
| ACCUEIL |
|
Publié sur :
Publication Powerpoint delepine - 2005
Voir la version PDF de cette publication : Routine determination of Ifosfamide and metabolites for adjustement of dose in treatment session in children B. Gourmel, S. Alkahallaf, B. Markowska, Gérard Delépine, Nicole Delépine Routine determination of Ifosfamide and metabolites for adjustment of dose in successive treatment sessions in childrenGoal of Study-To improve tolerance and effectiveness of high dose ifosfamide in children. -By individualising treatment dosage following pharmacokinetics data. -To find mathematic expression of toxicity and effectiveness. Background study-Ifosfamide is one of the current reference agents for the treatment of sarcoma, especially in children. -This prodrug is metabolized by two possible pathways: -Either by deactivation to produce the dechloroethylated metabolites 2D and 3D Ifos. -Or by activation with hydroxylation in position 4 to produce 4 OH Ifos. This compound is split within the cell into acrolein and mustard, the true alkylating agent of ifosfamide (Fig. 1). Moreover, the mother substance is able of autoinduction by activating cytochrome P-450 in liver microsomes. Preliminary ResultsOur previous results indicate that this administration protocol in children allows a controlled autoinduction process to be obtained for ifosfamide (Fig.2). This process is characterized by a stabilized and measurable production of the inactive metabolites and at the same time ensures regular and constant formation of 4 OH. 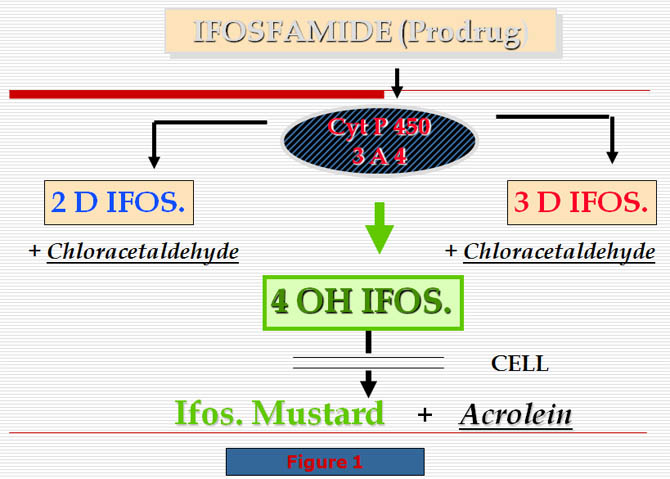 Previously StudyPreviously, we reported a study concerning 7 patients aged from 2 to 19 years and suffering from sarcoma, who were followed over 4 months, during their treatment sessions by ifosfamide (Ifos.) We estimated the variations of ifosfamide and its metabolites blood levels during the Ifosfamide continuous infusion (5 days). The Area Under Curve (AUC) for ifos. and its metabolites, AUC 0-24, 24-48,.. were established for each compound and for each treatment session. The metabolite index (MI) was: AUC metabolite/AUC of Ifos. (MI day1, day2,... MI day5). The statistical comparison demonstrated that no significant difference existed between treatment sessions 1 to 4 either for the blood levels of Ifosfamide than the estimation of the percentage of induction. No significant differences were demonstrated also for the variation of inactive metabolites and Metabolite Index during the infusion. whatever treatment session was considered. Percentage of Ifosfamide induction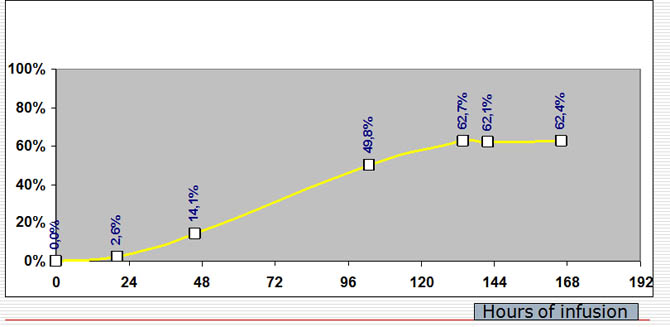 Percentage of Ifosfamide induction during a seven days continous infusion at a dose of 3g/m2/day. Percentage of induction of ifos following the infusion dayVariations of induction percentage compared to maximal value of ifosfamide at the 24th hour of infusion and following days: -it attains more than 50% (62%) at the fourth day and remains stable the following days exceptionally if the drug is bad metabolized by the patient the plate can be attained later associated drugs or orange juice or grapefruit can modify the PK and delay or accelerate the apparition of the plate. Method- Determination of each compound (ifos., 2 and 3 dechloro-ifos. and 4 hydroxy-ifos.) was performed using a G.C analytical method, which allows simultaneous detection of the 4 compounds and the internal standard (trofosfamide) during the same chromatogram - Blood samples were withdrawn each day: (T0, T24, T48, T72, T96 and T120) included patients in this study were children between 2 and 19 years of age hospitalized in our oncology department for sarcoma. - The treatment consisted of continuous infusion of ifosfamide at a dose of 3 g/m2/day for 4, 5 or 6 days during a 4- or 5-week period depending on the treated pathologies. New study: results-A similar comparison method was employed for 8 new patients following the same schedule. -Once again no statistical differences were found either in the autoinduction of the parent compound as well as in the production of the metabolites and the metabolite index. An exemple of these kinetics (Ifosfamide and its 3 metabolites) is shown in figure 3. ResultsThese results enable us to predict the drug comportement during a next treatment session administred in the same conditions (drug delivery, days of infusion and associated therapeutics). Indeed in the case of an increase in the inactive metabolites for a given patient. In order to quantify these effects and drug metabolism. we reported the cumulated area of the parent coumpond, the sum of 2 and 3 dechloro Ifos and the 4 OH Ifos. on an single graph. Pharmacokinetics of Ifosfamide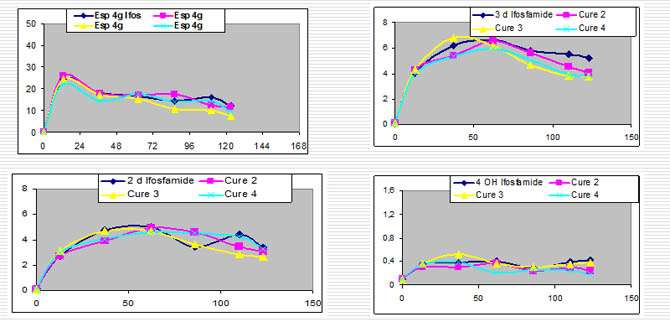 Pharmacokinetics of Ifosfamide,2 and 3 Dechloro ethyl Ifosfamide and 4 Hydroxy Ifosfamide over 4 consecutive treatment sessions. Comments figure: -Illustration of the serum concentrations of ifos -max concentration is obtained between 24 - 48 hours following the beginning of infusion. -then with a same dosage , concentrations fall to reach a min value at the 4,5,6 th day. -serum ifos is relatively stable at the 4 , 5 or 6 th day. -It is important to point out the stability of kinetics in a same patient for all courses with the same sheme of infusion and dosage (with same conditions , associated drugs etc.) -same kinetics curve and same metabolism -this points out that if induction exists ,it doesn't persist after3 or 4 weeks to point out the stability of kinetics in a same patient for ifos , prodrug but the same for metabolites 2 dechloroethyl ifosfamide in the four courses, idem for the 3 dechloroethyl ifosfamide. 3 dechloro ifos kinetics in four consecutive coursesIf kinetics of metabolites are comparable 3D elimination is superior to 2d ifos in all patients and all curves elimination these two metabolites are corellated with equimolar concentration of chlorocetaldehyde with the consequence of neurological side effects. These constatations permit to predict toxicity of next cure and adapt the dosage in a particular patient. Typical curves of cumulated areas of four patients are shown in figure 4 In these conditions we observed an excellent correlation for curves. 4 OH IFOS active drug PKReproduction of PK in the 4 courses as for others This permits to predict effectiveness of ifos Summary of these constations-In the first course we can predict the neurologic toxicity of the used dosage and to decrease the dosage for next days -For the next course we can decrease the initial dosage if toxic metabolites too high to avoid neurologic toxicities to increase the dosage if active drug and toxic metabolites are too low to abandonate the use of ifosfamide in this patient if the active drug is too low. -correlation with clinical effects are naturly recommanded. Linked parameters to total AUC or cumulated AUC during kineticsmethod used for calculation:trapezoidal method we can reflect about AUC of various parameters by three ways: -using cumulated AUC between beginning and end of the course -using time evolution of these AUC between two times of infusion (this permits to calculate the metabolic index at each time of the infusion). -using cumulated AUC curves at each time of the infusion. Cumulated AUC curves during infusion time of Ifos and metabolites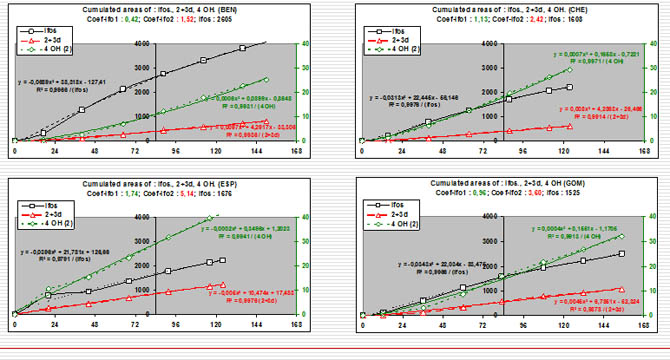 We can represent the results by the curve of cumulative values of AUC following time. if we consider the obtained curve by cumulative AUC during the infusion time we observe that they are exactly correlated with an equation: y= Ax² + bx + c this correlation is true for the prodrug ifos and for the sum of there inactive metabolites and also for this of the active metabolite. high correlation coefficient : all >0.99 This representation is particularly clear for ifos AUC and for the possibilities to obtain the active metabolite. calculated value at the time 84 (H84 following the beginning of the infusion) X=84 with the equation. Gourmel coefficient: gourmel coefficient ifo1 = calculated value AUC 4OH x100 ------------------- ( AUC 4OH et AUC IFOS à H84 ) calculated value AUC IFOS gourmel coefficient ifo 2 = calculated value cumulated AUC inactive metabolites (2D +3D)x10 ---------------------------------------------------------------- calculated value of cumulated AUC IFOS ( at H84 ) the calculation of the coefficient named IFO 2 is useful to evaluate the toxic risks The coefficient IFO1 must be the highest possible to reflect the active potential of the drug ifos. It must be assiciated with a coefficient IFO2 the lowest as possible to minimaze the neurologic riks that it is the evaluation. We could evaluate clearly the patient comportment against the drug and predict toxicity and also the potential effectiveness. Conclusion about the clinical use of PK of ifosfamide and metabolitesFollow-up of ifosfamide concentrations and of its metabolites seams us to be an excellent method for good use of ifosfamide , in particular in sarcoma treatment.To day it is especially useful to prevent toxic nervous side effects. The use of the equation of the AUC and the calculation of the two Gourmel coefficients must permit to obtain a good prediction of the drug effectiveness. We must now confront these factors with clinical results , either clinical symptoms of intolerance as long term survival of patients. |
||
|
|
© Nicole Delépine - Biographie - Avocat famille Angers - Webangelis - Voyance |